We estimate that x% of those in the carpentry workforce have a level 4 qualification. With current training volumes, that proportion will settle at about 40% of the workforce. Doubling current training volumes would increase the proportion to 50% by 2040.
Determining the proportion of a workforce that hold a relevant qualification is a difficult task. Census data can tell us how many workers have qualifications at a particular level, but it can't tell us whether that qualification relates to their current job, and it is only available at five year intervals. We can also look at training data which tells us how many students and apprentices complete qualifications each year, but this training data doesn't go back far enough to cover an entire workforce.
To overcome these limitations, we employ an agent-based model of a workforce. We'll model the carpentry workforce.
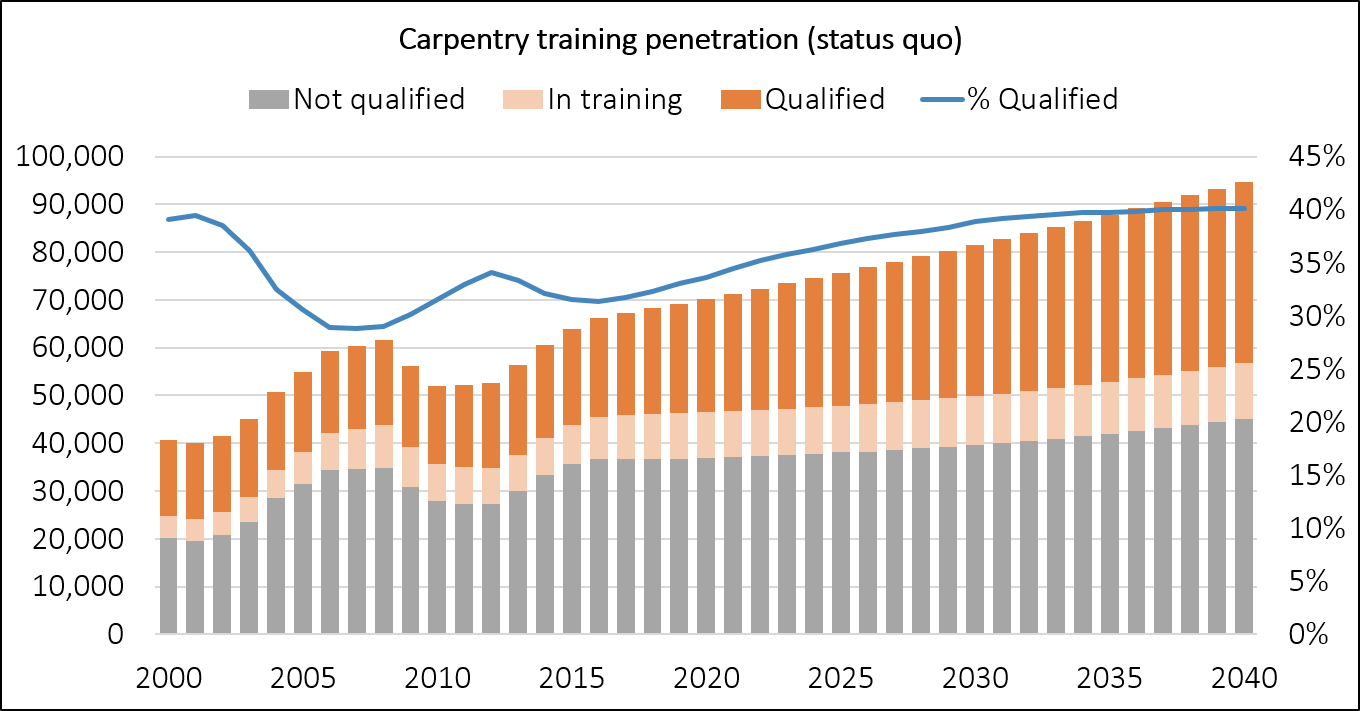
First, we'll calibrate the model to historical data on BCITO apprenticeships, then, to project forward in time, we'll assume the status quo in terms of training rates. We assume 1.5% growth in workforce numbers per year based on recent population growth.
The first point to notice is that rapid increases in workforce size cause a drop in the proportion of qualified workers. For example, from 2000 to 2007, the size of the carpentry workforce increased from 40,000 to 60,000, while the proportion of the workforce with a qualification dropped from almost 40% to below 30%. The reason for this is that almost all of the new workers entering the industry will be unqualified, and they are entering the industry much faster than they can be trained. We can also the opposite effect between 2008 and 2011 where a drop in workforce size causes an increase in the proportion of qualified workers, as the first workers to leave are recently hired, unqualified workers.
The other important point is that there is an equilibrium for the proportion of workers with qualifications. In the current scenario, this equilibrium is about 40%. It is also clear from the model that changing the overall proportion of qualified workers is a slow process.
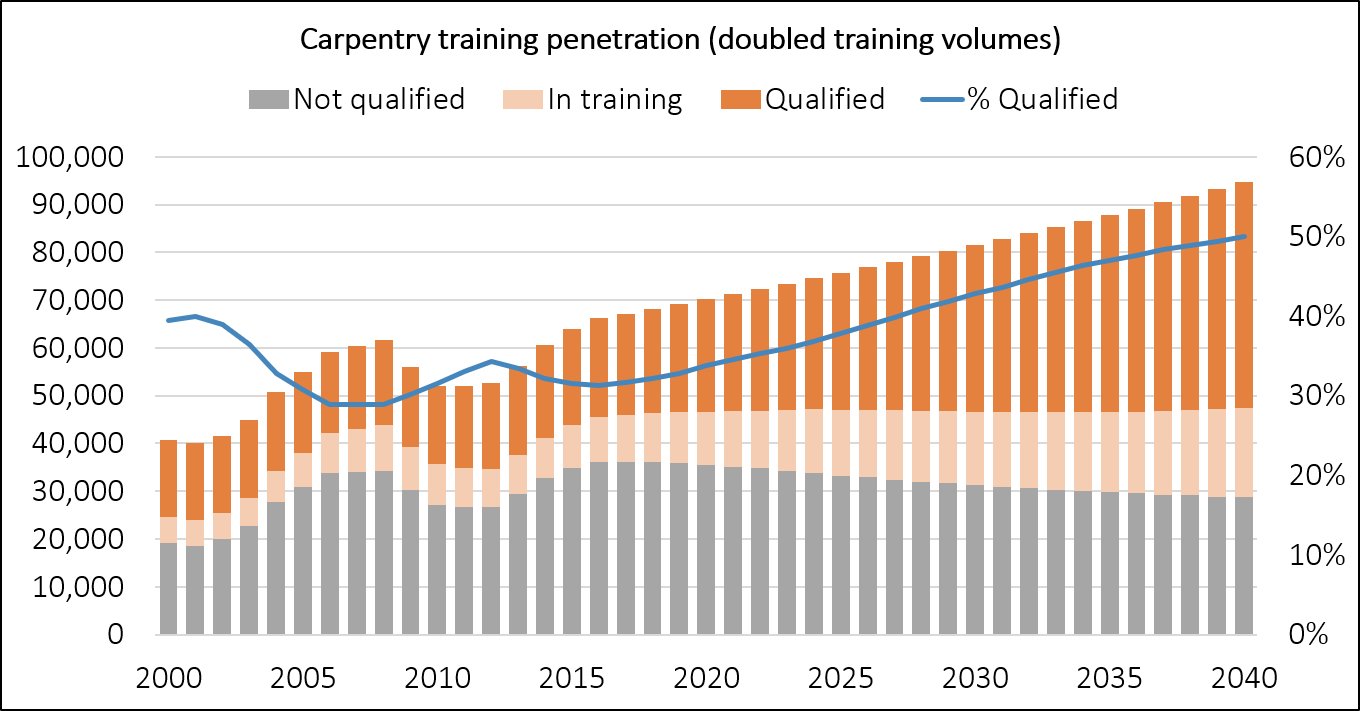
Next, we'll imagine a scenario where training volumes gradually increase to approximately twice current levels by 2040.
This obviously increases the rate at which the qualified proportion of the workforce increases. It also increases the equilibrium proportion of qualified workers. By 2040, in this scenario, the proportion has increased past 50% and is still rising. Compare this with the status quo scenario where the qualified proportion has flattened off at 40% by 2040.
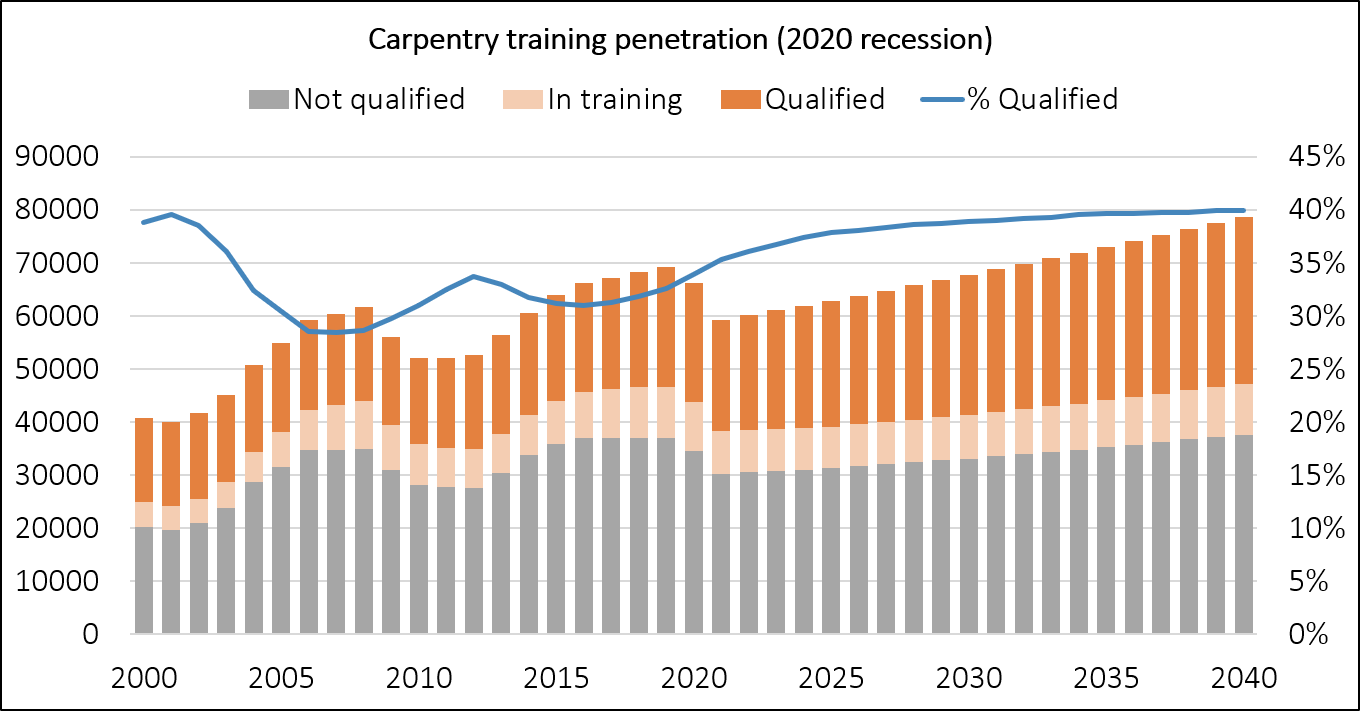
We can also test scenarios where demand for workers rapidly decreases as in a recession. In the next scenario we imagine that the number of carpentry workers decreases by 10,000 by the end of 2021, before increasing gradually again.
This does not change the equilibrium qualified proportion, as we haven't changed training rates or long term workforce growth. In fact, in this scenario, we get to this equilibrium more quickly, as the effect of the sharp drop in workforce size is to increase the proportion of qualified workers.
Inchworm, our agent-based model of a workforce, allows us to overcome limitations in training data and make projections of training penetration based on different scenarios.
There are limited data on the total number of qualified people in a workforce over time, but by using data on the number of people gaining qualifications each year, and a model of the workforce, we can make estimates of this number which agree with the data that we do have.
We can then project these numbers forward in time based on different plausible scenarios such as an increase in training numbers, or a recession causing a drop in worker numbers.
Access to the data used in this study was provided by Stats NZ under conditions designed to give effect to the security and confidentiality provisions of the Data and Statistics Act 2022. The results presented in this study are the work of the author, not Stats NZ or individual data suppliers.
These results are not official statistics. They have been created for research purposes from the Integrated Data Infrastructure (IDI) which is carefully managed by Stats NZ. For more information about the IDI please visit https://www.stats.govt.nz/integrated-data/.
The results are based in part on tax data supplied by Inland Revenue to Stats NZ under the Tax Administration Act 1994 for statistical purposes. Any discussion of data limitations or weaknesses is in the context of using the IDI for statistical purposes, and is not related to the data's ability to support Inland Revenue's core operational requirements.