Understanding the differences between the characteristics of women and men in the trades can provide insight into strategies to boost participation by women. The women in the trades sector workforce tend to be slightly older than their male counterparts and more ethnically diverse. A woman in the trades is less likely to be an employer than a man in the same workforce. Improving these outcomes of women in the trades should be considered when assessing how to boost women participation.
This report aims to get a snapshot of the current demographic differences between men and women in the trades. These differences can assist with understanding why there is a disproportionate representation of women in the trades and potentially provide insight into how to make a career in the trades more attractive to women. This study analyses a snapshot of women in the trades in 2013.
The census is held every five years and collects data on every New Zealander’s occupation and the industry of the business they work for. This information can be used to define a workforce precisely at that point in time. The data in this report is from the 2013 census, so presents an accurate depiction of women in trades at that point in time.
The chart below represents the age profile of men and women in the trades. Across all trade sectors, women tend to be slightly older than men. Men are roughly equally spread between their twenties and fifties, while women are more concentrated in their forties and fifties. It is unclear what has caused this trend; it could imply historic success in attracting women, higher retention of older women or it could be a result of an unrelated demographic trend. This trend does not hold for painting and decorating, mechanical engineering and electrotechnology where women tend to be younger than men. For the painting and decorating sector, this may reflect the increased proportion of women among recently trained workers.
Methodology
The data is from the 2013 census. When using census data we can use both industry and occupation data to classify people as workers in particular sectors. Our approach is to use a combination of core industries and occupations, and compatible occupations.
If someone works in a core industry and a compatible occupation, they are classified as working in the sector. Occupations are more specific in identifying people as part of trade workforce so anyone with a core occupation is classified as working in the sector.
Use the drop-down menu on the bottom-right to choose a sector. The tables below will show the lists of core and compatible industries and occupations used to define the sector workforces from the census data.
The chart below compares the ethnicities of men and women in the trades. Around 73% of men workers are European, while only 56% of women are. Overall, women are more ethnically diverse than men in the trades, particularly in the electrotechnology, engineering and manufacturing sectors. The distribution of ethnicities overall varies between different sectors. The forestry sector is the most diverse sector overall, where Māori are represented at over 30%.
Methodology
The data is from the 2013 census. When using census data we can use both industry and occupation data to classify people as workers in particular sectors. Our approach is to use a combination of core industries and occupations, and compatible occupations.
If someone works in a core industry and a compatible occupation, they are classified as working in the sector. Occupations are more specific in identifying people as part of trade workforce so anyone with a core occupation is classified as working in the sector.
Use the drop-down menu on the bottom-right to choose a sector. The tables below will show the lists of core and compatible industries and occupations used to define the sector workforces from the census data.
The dashboard below breaks down the employment type by men and women in the trade workforce and can be broken down further by sector. The key observation from this is that women have lower self-employment rates than men. They are also less likely to be an employer and are more likely to be an unpaid family worker, particularly in the carpentry sector.
Methodology
The data is from the 2013 census. When using census data we can use both industry and occupation data to classify people as workers in particular sectors. Our approach is to use a combination of core industries and occupations, and compatible occupations.
If someone works in a core industry and a compatible occupation, they are classified as working in the sector. Occupations are more specific in identifying people as part of trade workforce so anyone with a core occupation is classified as working in the sector.
Use the drop-down menu on the bottom-right to choose a sector. The tables below will show the lists of core and compatible industries and occupations used to define the sector workforces from the census data.
Access to the data used in this study was provided by Stats NZ under conditions designed to give effect to the security and confidentiality provisions of the Data and Statistics Act 2022. The results presented in this study are the work of the author, not Stats NZ or individual data suppliers.
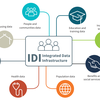
These results are not official statistics. They have been created for research purposes from the Integrated Data Infrastructure (IDI) which is carefully managed by Stats NZ. For more information about the IDI please visit https://www.stats.govt.nz/integrated-data/.
The results are based in part on tax data supplied by Inland Revenue to Stats NZ under the Tax Administration Act 1994 for statistical purposes. Any discussion of data limitations or weaknesses is in the context of using the IDI for statistical purposes, and is not related to the data's ability to support Inland Revenue's core operational requirements.